Market Update · Colorado Springs
Short-Term Rentals in Colorado Springs: Let's Pull Back the Curtain
Iggy, Summit Short Term Rentals · November 3, 2026 · 7 min read
Ever wonder how many short-term rentals are in Colorado Springs, how strong demand is, or whether hosts are really getting rich? Let's take a quick look behind the curtain.
First, a note about scope: this report covers the Colorado Springs market shown below. Every city and county has its own rules, so we're keeping this snapshot to the area represented here.
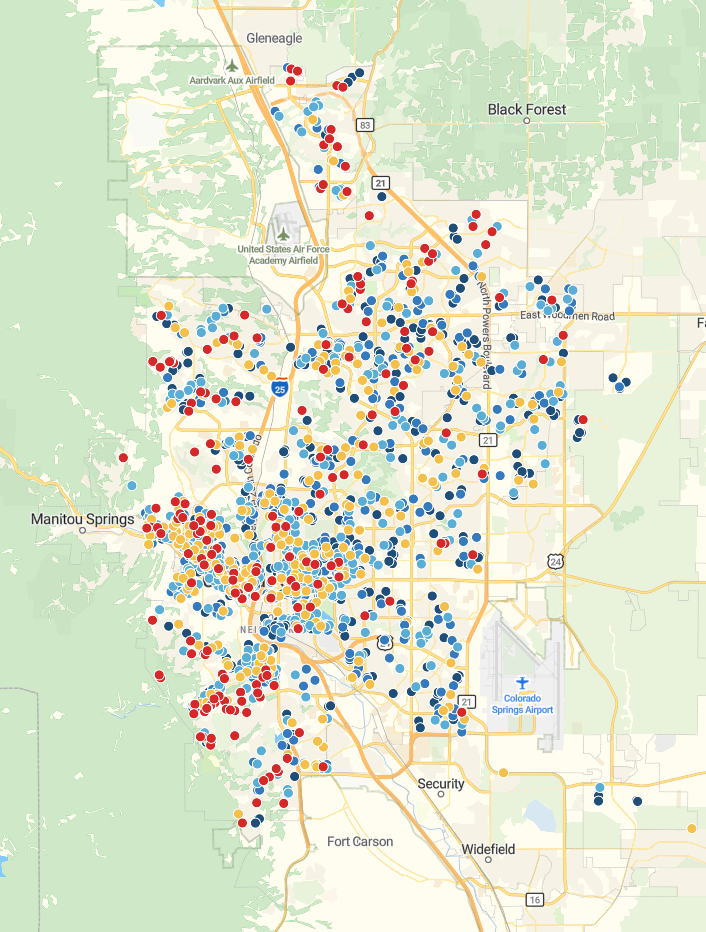
Counting Short-Term Rentals
There's no perfect way to count every short-term rental. City permits are one useful data point. The last time I pulled the city's permit data, it showed about 1,036 permits.
But a permit doesn't prove that a property is currently operating as a short-term rental, and the absence of a permit doesn't prove that it isn't.
There's also no single database covering every booking platform. Some properties appear on Airbnb, Vrbo, Booking.com, and smaller sites; others are listed on just one. Because listings overlap, we can't simply add each platform's count and call it the total.
So, rather than claim an exact inventory number, we'll follow the data we can access consistently and watch for changes over time.
What the Platform Data Shows
In the Colorado Springs market shown in these reports, Airbnb has about 2,200 available listings and Vrbo about 825. Some properties appear on both platforms, so those numbers shouldn't be added together as unique homes.
The reports' longer-term charts suggest Airbnb and Vrbo listing counts may be moving in different directions. Airbnb has lost roughly 400 units — from about 2,600 in 2025 to about 2,100 today. Vrbo has gained about 250 units over the same time, up to about 850. This is likely a reflection of how different policies and approaches drive host sentiment.
Fees and Policy Changes
Airbnb moved from a split service fee to a single host-paid fee of 15.5% for most hosts. Under the previous split structure, most hosts paid 3%, while guests paid a separate service fee of about 12%. Airbnb rolled out the change in stages, which meant hosts didn't all face the same fee structure at once. This created pricing disparities in the market for several months.
Airbnb is also changing what hosts can ask guests to do at checkout, with the new policy taking effect November 20, 2026. Hosts generally can't require guests to wash dishes, start laundry, or take trash off-site. They can still ask guests to leave dishes in the sink, gather used towels, or sort trash into designated bins.
Vrbo has begun rolling out a 12% host commission for affected listings, starting with new bookings on or after October 29. The timing can vary by account and listing.
The platforms also handle host protections differently. Vrbo offers separate protection options, while Airbnb's AirCover has its own terms, conditions, and exclusions. Airbnb says its damage protection isn't insurance or a substitute for a host's own coverage, so it's worth understanding exactly what applies to each booking. The customer service for both platforms leaves plenty to be desired.
We'll take a closer look at fees, host protections, and service in future posts. For now, the main point is that platform policies can affect both a host's costs and the way they run a property.
With the context of the overall market set, let's take a dive into the numbers for both platforms.
Colorado Springs Airbnb Market Pulse: a steady year, followed by a softer month
Data snapshot: Nov. 2, 2026 | Source: PriceLabs, Airbnb whole-market dashboard
The 365-day Airbnb picture in Colorado Springs is relatively steady, but the latest month is more concerning. Annual estimated occupancy averaged 62%, down 3 percentage points from the same time last year. ADR edged up $2 to $152, while RevPAR slipped $2 to $95. Estimated rental revenue was $29.95K, down $879 year over year (about 3%).
The 30-day slice weakened more sharply. Occupancy was 63%, 6 points below last year. ADR was $130, down $31 (about 19%), and RevPAR was $82, down $29 (about 26%). The dashboard's estimated rental revenue was $2.31K, down $823 (about 26%). In other words, recent softness is showing up in both the number of nights filled and the amount earned per available night.
The 7-day snapshot shows 52% occupancy, $105 ADR, and $55 RevPAR. Occupancy was 10 points below the same time last year; ADR was down $7 and RevPAR was down $14. This short slice is a useful pulse, but too volatile to call a trend by itself.
What stands out
- The annual baseline is close to flat. ADR was slightly higher year over year, while occupancy and RevPAR eased modestly.
- The last month is the clearest warning. Occupancy fell 6 points and ADR about 19% year over year, leaving RevPAR about 26% lower.
- Weekends still outperform midweek. The annual dashboard shows Friday and Saturday occupancy near 69%, versus about 55% on Tuesday. Friday and Saturday also have higher price factors than early-week days.
- Holiday date signals remain. PriceLabs flags Nov. 23–27 as 25% busier and Dec. 22–28 as 13% busier than surrounding dates. These are forward-looking occupancy signals, not guaranteed reservations.
- Booking lead times are fairly short. The 30-day dashboard reports an 18-day booking window. Hosts may want to watch pickup over the final two to three weeks before arrival and adjust rates as needed.
- There are useful listing-detail clues. The dashboard's desired-amenities panel puts free street parking, coffee, and private entrance among the strongest signals. Treat these as ideas to investigate for a specific property, not proof that adding an amenity will cause more bookings.
Takeaway for local hosts
The year-over-year baseline still looks workable, but the most recent month shows real pressure. Keep a close eye on pickup, ADR, and RevPAR; use weekday-specific pricing; and protect rates on the holiday dates where the forward-looking signal is stronger. Compare against a like-for-like property set before making major changes — the whole-market averages are context, not a property-level pricing recommendation.
Colorado Springs Vrbo Market Pulse: occupancy holds while rates soften
Data snapshot: Nov. 2, 2026 | Source: PriceLabs, Vrbo whole-market dashboard
Colorado Springs Vrbo occupancy has held up better than nightly pricing. In the 365-day dashboard, estimated occupancy averaged 64%, up 1 percentage point from the same time last year. But average daily rate (ADR) fell $19 to $198, and revenue per available rental night (RevPAR) fell $9 to $127.
The most recent 30-day slice tells a more pressured story. Occupancy was 65%, close to the annual baseline but 4 points below last year. ADR was $171, down $41 (about 19%) year over year. RevPAR was $111, down $35 (about 24%). That points to pricing and revenue per available night as the clearest headwinds, more than a collapse in occupancy.
The 7-day snapshot was softer: 51% occupancy, $138 ADR, and $71 RevPAR. Compared with the same time last year, occupancy was 10 points lower, ADR was down $15, and RevPAR was down $22. A single week is a small, volatile slice, so treat it as a near-term pulse rather than a new market trend.
What stands out
- Pricing is the main pressure point. Annual ADR is down about 9% year over year; the 30-day slice is down about 19%.
- The recent month is mixed. At 65%, occupancy is close to the 64% annual baseline, even as it trails last year by 4 points. Softer ADR is dragging RevPAR lower.
- Weekends remain stronger. The annual dashboard shows Friday and Saturday occupancy around 70%, compared with about 56% on Tuesday. Weekend price factors are also higher than early-week rates, supporting active day-of-week pricing.
- There are forward-looking holiday demand pockets. PriceLabs flags Nov. 23–27 as 32% busier and Dec. 23–28 as 16% busier than surrounding dates. These are occupancy signals for future dates, not confirmed reservations.
- Supply has expanded over the longer view. The annual dashboard's history chart rises from roughly 650 active listings early in 2025 to about 840 by fall 2026. More listings mean guests have more options and hosts need to compete on value, presentation, and availability.
Takeaway for local hosts
A healthy occupancy figure by itself can hide softer economics. Keep a close eye on ADR and RevPAR, protect rates on high-demand weekends and holidays, and stay flexible on softer midweek dates. Compare performance against a like-for-like property set before changing rates; the broad Vrbo market is context, not a property-level pricing recommendation.
Free · 2 minutes
Where does your property land in this market?
Market averages are context. Our free AI property valuation looks at your specific home and gives you a realistic Colorado Springs revenue range.
Get my free property valuation